Land-Use Emulator
The land-use emulator integrates a set of land-use scenarios into MESSAGEix energy system model. These land-use scenarios are developed by an economic land-use model GLOBIOM, which can assess competition for land-use between agriculture, bioenergy, and forestry. The land-use scenarios represent a two dimensional scenario matrix (so called Lookup-Table) combining different carbon and biomass price trajectories which allows to represent biomass supply curves conditional on different carbon prices as well as marginal abatement cost curves conditional on different biomass prices for the land-use sector in MESSAGEix. This linkage between an energy model, here MESSAGEix, and a land-use model is important to explore the potential of bioenergy and the implications of using biomass for energy generation on emissions, the cost of the system, and related land-use implications. In MESSAGEix formulation, there is a dedicated set of land use equations, to establish this linkage as follows. Each land-use scenario represents a distinct land-use development pathway for a given biomass potential and carbon price. The biomass potentials for use in the energy sector are determined by the biomass price. At lower biomass prices, biomass mainly stems from forest residues, for example from sawmills or logging residues. With increasing prices, land-use will be shifted to make room for fast-rotation tree plantations, purposely grown for use in energy production which may cause indirectly through increased competition with agricultural land deforestation of today’s forest. At very high prices, roundwood will be harvested for energy production (for further details see Forestry) competing with material uses. In addition, for each level of biomass potential, different carbon prices reflect the cost of mitigation for land-use related greenhouse gas (GHG) emissions. For example, the matrix depicted below (Fig. 23) illustrates the combination of biomass and carbon prices for each of which a distinct land-use scenario has been provided by GLOBIOM.
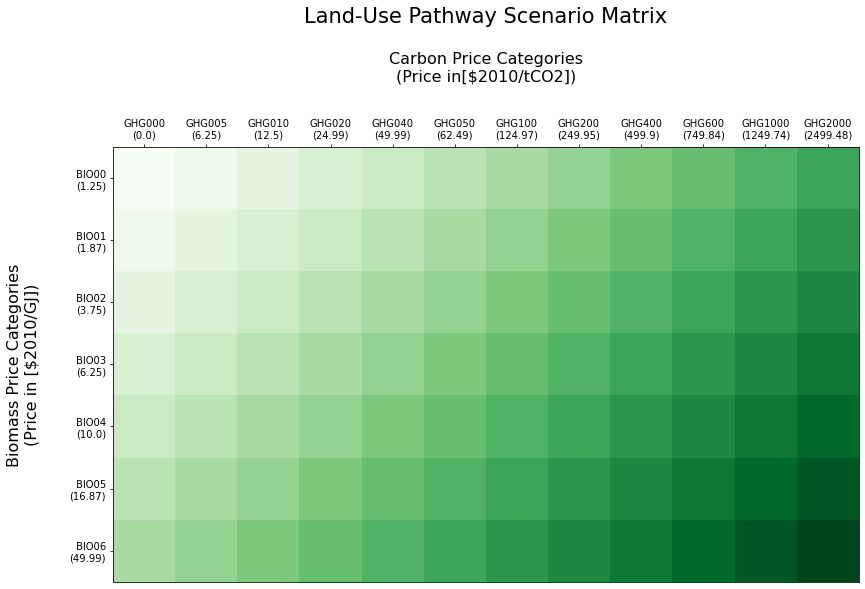
Fig. 23 Land-Use Scenario Matrix.
In their entirety, the combination of these distinct land-use pathways provide MESSAGEix with a range of biomass potentials available for energy generation at different costs, so called BIO-categories, along with the associated land-use related emissions (CO2, CH4 and N2O). The different carbon prices provide MESSAGEix with options for mitigating land-use related GHG emissions, referred to as GHG-categories. The combination of land-use pathways can therefore be depicted as a trade-off surface, illustrated for SSP2 (Fricko et al., 2017 [17]) in the figure below (Fig. 24). The figure depicts global biomass potentials and respective GHG emissions at different carbon prices cumulated from 2010 to 2100.
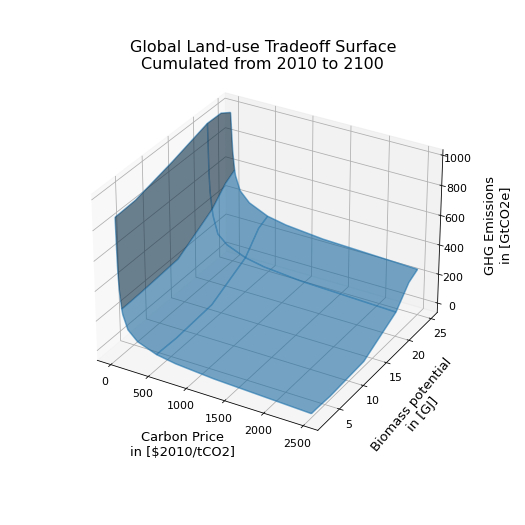
Fig. 24 Land-Use Pathway Trade-Off Surface for SSP2.
From the trade-off surface it possible to deduct that for a MESSAGEix scenario without climate policy, land-use pathways of the lower BIO-categories and lowest GHG-categories will be used. The energy system will therefore only use biomass for energy production to the extent that it is economically viable without mitigating emissions. When climate policy scenarios are run in MESSAGEix, the land-use pathways will be chosen such that the optimal balance between the land-use related emission and biomass use in the energy system is obtained. In addition to serving as a commodity from which energy can be generated, biomass can also be used to obtain negative emissions via BECCS.
Adaptation of the Reference-Energy-System (RES)
Prior to the use of the land-use emulator, biomass supply-curves were used to inform the energy system of the biomass availability. The emulator replaces supply-curves, by incorporating all the land-use scenarios in MESSAGEix, therefore the choice of which land-use pathway(s) becomes part of the entire optimization problem. Conceptually, each land-use scenario is incorporated similarly to any other technology in MESSAGEix, each providing biomass at a given price and corresponding GHG-emissions. The incorporation of the land-use emulator requires two changes to the RES to be undertaken. On the on hand, an additional level/commodity has been introduced to link the land-use pathways with the energy system, while land-use emissions are accounted for in the emissions equation (emissions equations in MESSAGEix).
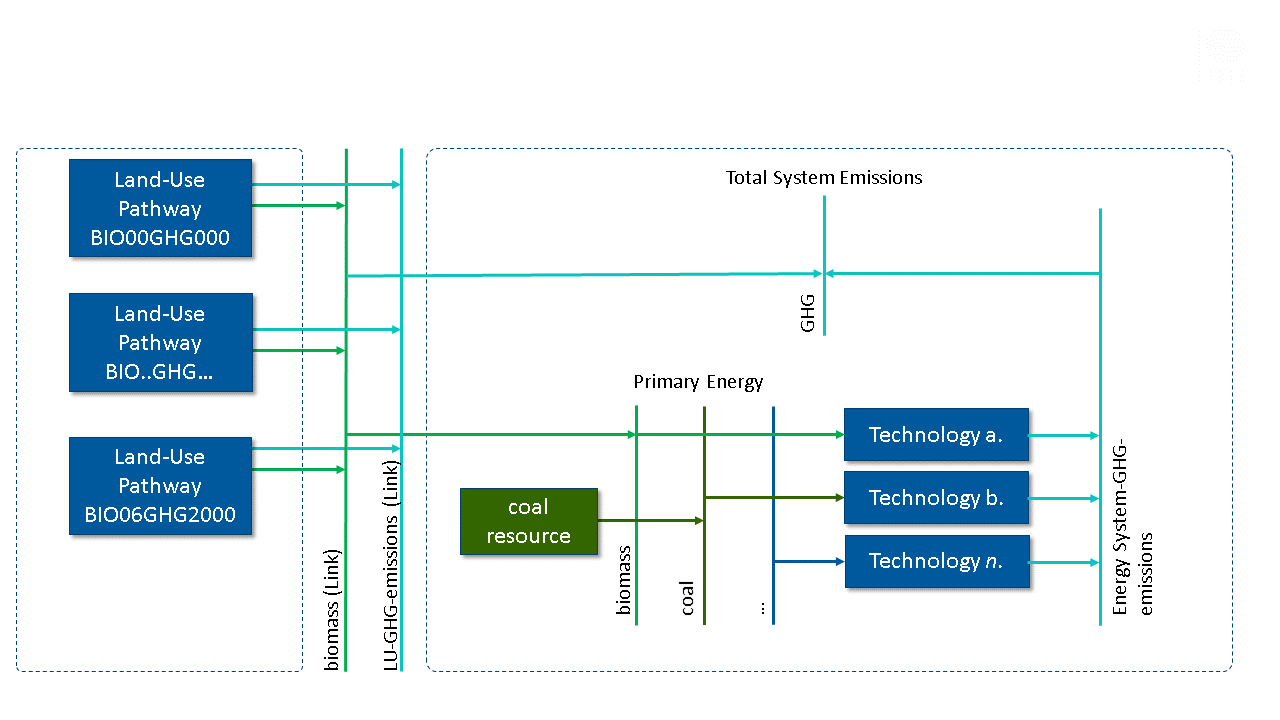
Fig. 25 Adaptations of a simplified RES for inclusion of the land-use emulator.
Biomass, independent of the type of feedstock, is treated as a single commodity in the energy system. Bioenergy can therefore be used for use in power generation or liquefaction or gasification process alike (see Other conversion for further details). The only exception is made for non-commercial biomass (fuel wood). Non-commercial biomass supply and demand have been aligned between the two models. These are derived based on population and GDP projections for each of the SSP storyline projections (Riahi et al., 2017 [84], Pachauri et al., 2017 [68]). In MESSAGEix, non-commercial biomass is explicitly modeled as a demand category (see Energy demand for further details). The reduction of non-commercial biomass demand therefore is not possible in the global energy model, without the use of an additional addon module specifically developed to address this issue (Poblete et al., 2018 [74], Poblete et al., [75]). The reason for this is the fact that non-commercial biomass is not a traded commodity and therefore its use us not determined as a function of cost.
Note, that because each of the land-use pathways has been calculated accounting for mitigation of all GHGs, MESSAGEix scenarios aiming to only reduce a single green-house-gas for example, will either need to account for the fact that a price on CH4 for example will equally result in reductions of CO2 and N2O in the land-use sector. Equally, other land-use policies, such as the limitation of deforestation, can be implemented, but will most likely include other land-use related trends, which are artifacts as opposed to results of the policy, due to the limitations of using an emulator, and therefore a limited solution space. The land-use pathways are meant to represent the broad, as opposed to a specific policy landscape, consistent with SSP storylines (Popp et al., 2017 [76]). For some larger projects or studies, matrixes, i.e. input data sets from GLOBIOM, can be tailored to allow the analysis of specific policies in MESSAGE.
Equations and constraints
The land use equations in MESSAGEix state that the linear combination of land-use pathways must be equal to 1 (Eq.2). Therefore, separately for each region, either a single discrete land-use scenario can be used, or shares of multiple scenarios can be combined linearly to obtain, for example, biomass quantities which are not explicitly represented as part of the land-use matrix. This also applies to the mitigation dimension, i.e., to the GHG categories.
In order to correctly represent the transitional dynamics between land-use pathways, such as the rate at which changes in land-use can occur, e.g. the conversion from land-type A to land-type B, additional constraints are required as the underlying dependencies between these land-use pathways are only represented in the full fletched GLOBIOM model. Based on rates derived from GLOBIOM, for each of MESSAGEix model regions, the upscaling of plantation forest area is limited using dynamic constraints on land-use. The total area of plantation forest in a given region and time-period is determined, by summing up the shares of area (Mha) for other land types (crop-, grass- and other natural land) in the previous time-period in that region (Eq.3). Therefore, the bigger area for the three land types is available, the bigger plantation forest area can be expanded in the following time-period. This growth constraint is applied for each land-use pathway individually.
The table below shows the shares of each land type for each region, \(X_{n}, Y_{n}, Z_{n}\). (for further details see Land use change).
Region |
Crop land [%], \(X_{n}\) |
Grass land [%], \(Y_{n}\) |
Other natural land [%], \(Z_{n}\) |
|---|---|---|---|
Sub-Saharan Africa |
0.05 |
0.05 |
0.05 |
Centrally Planned Asia and China |
0.05 |
0.05 |
0.02 |
Central and Eastern Europe |
0.05 |
0.02 |
0.02 |
Former Soviet Union |
0.05 |
0.05 |
0.02 |
Latin America and the Caribbean |
0.05 |
0.05 |
0.05 |
Middle East and North Africa |
0.05 |
0.05 |
0.05 |
North America |
0.05 |
0.05 |
0.02 |
Pacific OECD |
0.05 |
0.05 |
0.05 |
Other Pacific Asia |
0.05 |
0.05 |
0.05 |
South Asia |
0.05 |
0.05 |
0.05 |
Western Europe |
0.05 |
0.02 |
0.02 |
The growth constraint on plantation forest upscaling therefore implies that, should high quantities of biomass be required in the energy system, either a combination of land-use pathways needs to be used over time that will allow enough plantation forest area to be available under this specific constraint or alternatively land-use pathways corresponding to the highest BIO-category could be used from the very beginning of the century. The latter would require the energy system to transition quickly enough to allow the use of such high biomass-quantities.
In addition to constraining the growth of plantation forest (for further details see Forestry), the increase of the current forest area, representing the area of land currently covered by forests, is prohibited (Eq.4. The existing forest area can only be de-forested, and afforestation is depicted as another land-use type.
The third and last set of constraints required for the land-use emulator enforce gradual transitions between land-use pathways. Too rapid switches between land-use pathways, i.e. full transitioning between land-use pathways in adjacent timesteps, can occur for several reasons. Slight numerical non-convexities in input data, i.e. numerical inconsistencies can occur for individual time-steps. Land-use pathways, cumulatively (across time) depict consistent behavior i.e. as carbon prices increase, the cumulative emissions decrease within a single biomass potential category (see Fig. 24). Yet for the same carbon price across multiple biomass potential categories, inconsistencies may occur, for example as a result of data scaling or aggregation. Without a transitional constraint between pathways, the optimal least-cost solution could be to switch between two land-use pathways for only a single timestep, introducing artifacts in the model result (e.g. unreasonable price inconsistencies). The carbon price categories have been chosen to span a broad range of mitigation options (see Fig. 23), with stepped carbon price growth that best reflect increases in global mitigation efforts, while at the same time ensuring that inclusion of the land-use emulator in MESSAGEix, does not result in too long solving times. The transitional constraints between pathways further contribute to smoothing the step wise increases between the carbon price categories. The transition rate has been set, so that land-use pathways can be phased out at a rate of 5% annually. This value was derived based on a sensitivity analysis, showing that this factor best matched the transition results of the full fletched GLOBIOM model.
Land-use Price
In the figure depicting the land-use scenario matrix (Fig. 23), various biomass and carbon price categories are depicted. This information, together with the quantities of biomass and respective emission reductions are used to determine the land-use scenario price (objective function in MESSAGEix), which the model effectively interprets as the biomass price. Based on the first biomass potential category, BIO00, the price (\(P\)) for a distinct land-use scenario, in the example below without a carbon price (Eq.5), is a result of the biomass quantity (\(BQ\)) times the biomass price (\(BPr\)).
Following on from the above example, therefore staying within the lowest biomass potential category, as the carbon price increases, the costs of emission mitigation must be accounted for as part of the price (Eq.6). Hence, in addition to the quantity of biomass, the emissions savings must be calculated and multiplied with the carbon price (\(EPr\)). Below, we look at this example for the first carbon price of 5$, GHG005.
where \(E\) are the GHG-Emissions.
This can be generalized as follows:
where \(b\) represents the biomass-potential category, and \(g\) represents the carbon-price category.
The fact that biomass is the only land-use related commodity which MESSAGEix accounts for when optimizing, also means that all the costs associated with the mitigation of land-use related emissions are therefore perceived as being part of the biomass-price. This is a drawback of the approach, but nevertheless provides a full representation of the land-use scenario specific costs.
Results and validation
The first step in validating the emulator implementation, looks at how scenarios navigate throughout the land-use pathways over the course of a scenario. The figure below (see Fig. 26), shows the global mean temperature (panel a.) as well as the carbon price development for the various scenarios (panel b.). These include 1.) “Baseline”, a SSP2 based no-policy scenario, 2.) “NPi 1600”, a SSP2 based policy scenario with a cumulative CO2 budget of 1600 GtCO2 (limiting global temperature increase compared to pre-industrial times to approximately 1.9 °C), 3.) “NPi 1000”, a SSP2 based policy scenario with a cumulative CO2 budget of 1000 GtCO2 (limiting global temperature increase compared to pre-industrial times to approximately 1.6 °C), 4.) “NPi 400”, a SSP2 based policy scenario with a cumulative CO2 budget of 400 GtCO2 (limiting global temperature increase compared to pre-industrial times to approximately 1.3 °C). More details on these scenarios can be found here.
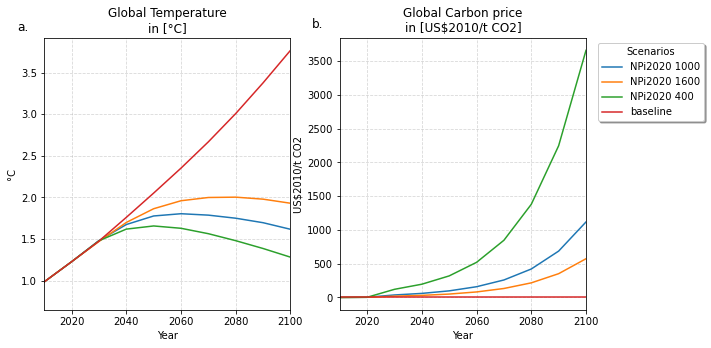
Fig. 26 Temperature and carbon-price development across CD-Links scenario set.
For each of the four scenarios, the land-use surface trade-off areas have been plotted (see Fig. 27). The orange shaded areas represent the choice of land-use pathways combined over time for all regions. In the “Baseline” scenario (see Fig. 27, panel a), only land-use pathways without a carbon price are used. In the least stringent mitigation scenario, “NPi 1600”, the carbon price reaches approximately 570 $2010/tCO2 in 2100. In 2090, the carbon price is approximately 350 $2010/tCO2, hence it is to be expected that by the end of the century land-use pathway categories no higher than GHG400 are used, (see Fig. 27, panel b). For the “NPi 1000” and the “NPi 400” scenarios, the land-use pathways with the highest carbon price, GHG2000 (which corresponds to approximately 2500 $2010/tCO2 are employed. Not visible from the figure is the timing at which the highest carbon price pathways are used. While in the “NPi 1000” scenario, the carbon price reaches approximately 1100 $2010/tCO2 and 1800 $2010/tCO2 in 2100 and 2110 respectively, the highest price land-use pathways are only partially used in some regions towards the end of the century. The categories which are mostly used are the GHG1000 categories, which correspond to ~1250 $2010/tCO2, (see Fig. 27, panel c). For the “NPi 400” scenario, where the carbon price rises above 2000 $2010/tCO2 already in 2090, the GHG2000 categories are used most commonly across all regions (see Fig. 27, panel d).
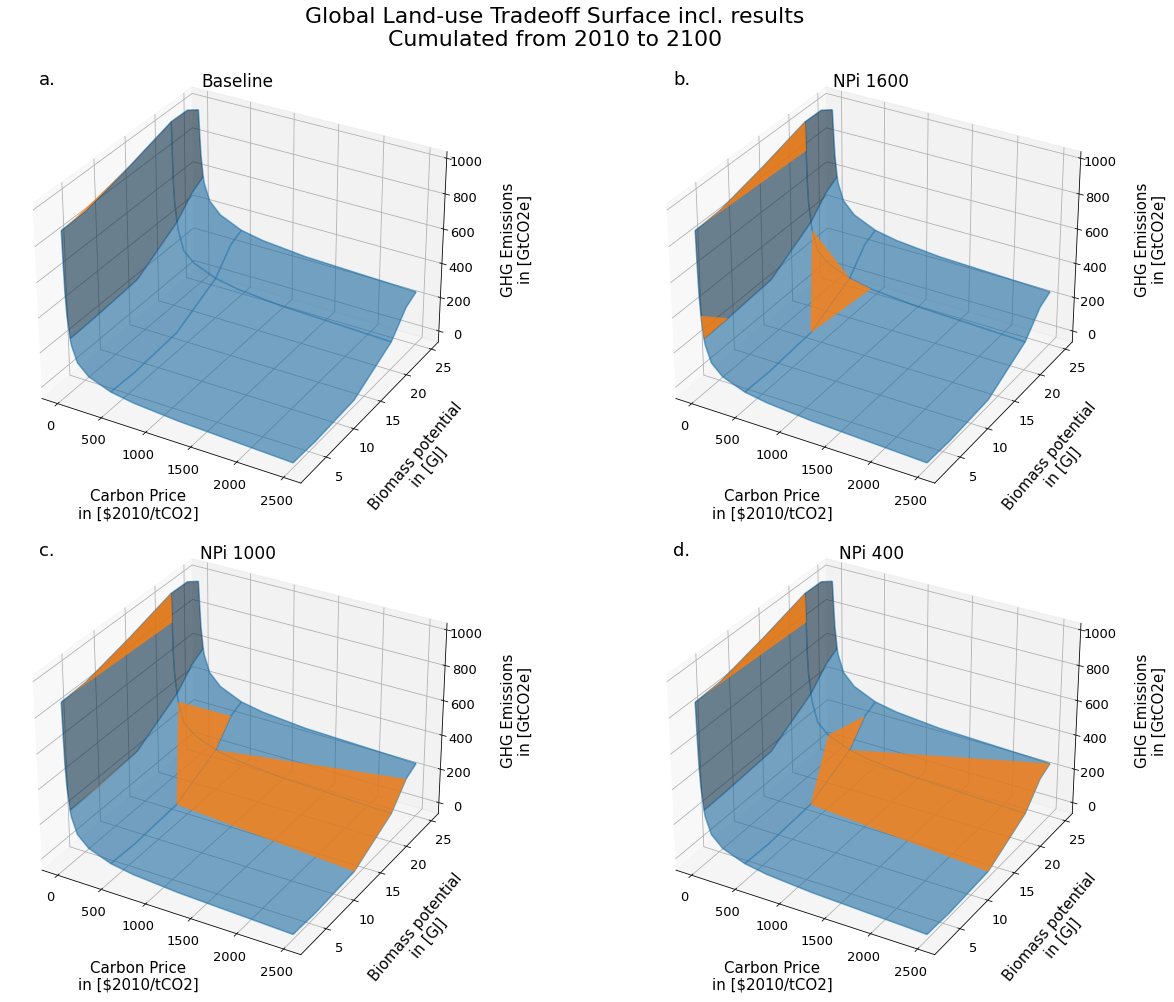
Fig. 27 Global land-use pathway choice across CD-Links scenario set.
Further validation of the land-use emulator implementation, is performed by setting the carbon price in MESSAGEix such that a specific GHG-category is predominantly used e.g. by setting the global carbon price in MESSAGEix slightly above the price for a specific GHG-category. If the carbon price is therefore set slightly above 500 $2010/tCO2 in MESSAGE, it is to be expected that the land-use emulator would use land-use pathways which fall into the GHG400 category. Fig. 28 depicts the results of four such validation scenarios. The carbon price in MESSAGEix is set so that the GHG-categories, GHG005, GHG100, GHG400 and GHG1000, (depicted in panel a., b., c. and d. respectively) are predominantly used cumulatively across all regions and the entire optimization time-horizon.
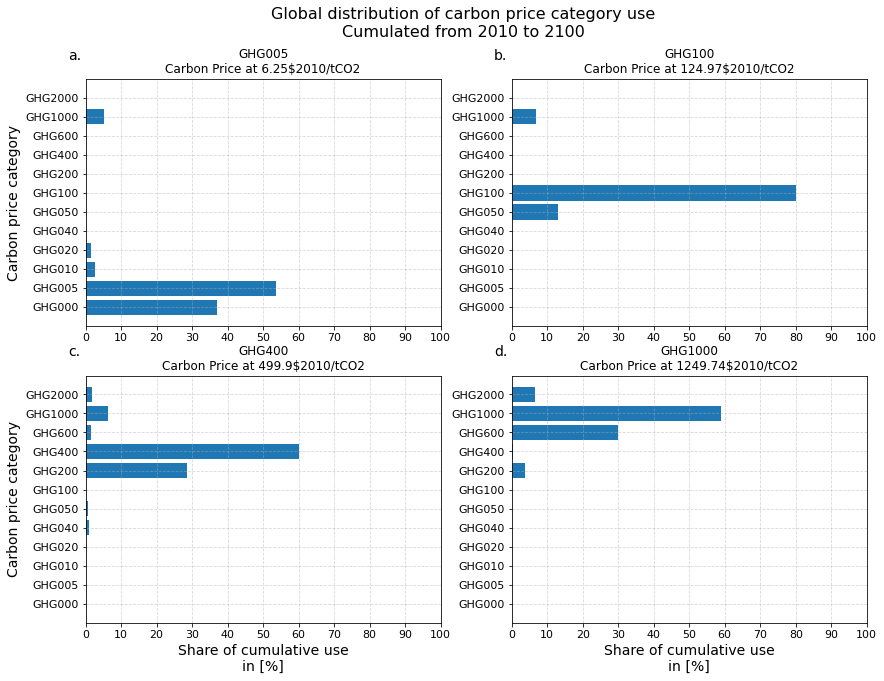
Fig. 28 Distribution of land-use related carbon price category use for different carbon price levels.
In addition to informing MESSAGEix of the biomass potential and land-use related emission quantities and prices, the land-use input matrix includes information related to land-use by type, production and demand of other non-bioenergy related land produces as well as information on crop-yields, irrigation water-use, amongst others. Region specific quantities of biomass from different feedstocks, the carbon price trajectory as well as GDP developments can be plugged back into the full fletched GLOBIOM land-use model. Thus, despite the slightly adjusted results, allows the land-use impacts to be analyzed in greater detail. Such validation or feedback-runs were conducted for the Shared Socioeconomic Pathways (Riahi et al., 2017 [88]). Fig. 29 compares how the emulated results (full lines) for GHG- (panel a.) and CH4 emissions (panel b.) across various scenarios compare with the results of the full fletched GLOBIOM model. The differences in emissions are updated in the original MESSAGEix scenario in order to correctly account for changes in atmospheric concentrations.
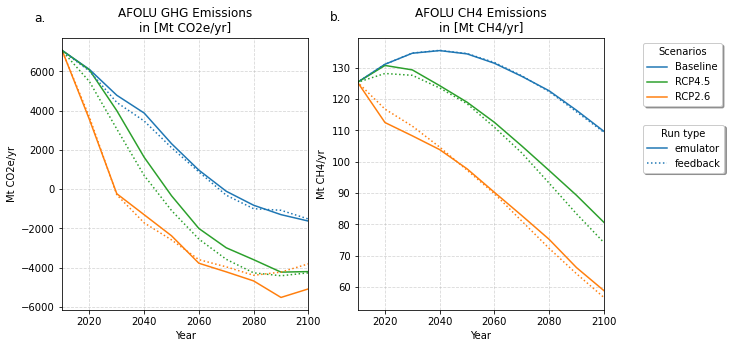
Fig. 29 SSP1 Emulated land-use results vs. GLOBIOM feedback.