Transport sector
The most commonly applied MESSAGEix transport sector representation is stylized and essentially includes fuel switching and price-elastic demands (via MACRO linkage) as the main responses to energy and climate policy (see Fig. 13).
In this stylized transport sector representation fuel switching is a key option to reduce emissions, i.e., different final energy forms that provide energy for transportation can be chosen from. In addition to the alternative energy carriers that serve as input to these stylized transportation options, their relative efficiencies are also different. The useful energy demand in the transportation sector is specified as internal combustion engine (ICE) equivalent demands which therefore by definition has a conversion efficiency of final to useful energy of 1. Relative to that the conversion efficiency of alternative fuels is higher, for example, electricity in 2010 has about a factor of three, higher final to useful efficiency than the regular oil-product based ICE. The overall efficiency improvements of the ICE in the transportation sector and modal switching over time is implicitly included in the demand specifications, coming from the scenario generator (see section on demand). Additional demand reduction in response to price increases in policy scenarios then occurs via the fuel switching option (due to the fuel-specific relative efficiencies) as well as via the linkage with the macro-economic model MACRO as illustrated in Fig. 13 below.
Limitations of switching to alternative fuels may occur for example as a result of restricted infrastructure availability (e.g., rail network) or some energy carriers being unsuitable for certain transport modes (e.g., electrification of aviation). To reflect these limitations, share constraints of energy carriers (e.g., electricity) and energy carrier groups (e.g., liquid fuels) are used in the transport sector. In addition, the diffusion speed of alternative fuels is limited to mimic bottlenecks in the supply chains, not explicitly represented in MESSAGEix (e.g., non-energy related infrastructure). Both the share as well as the diffusion constraints are usually parametrized based on transport sector studies that analyze such developments and their feasibility in much greater detail.
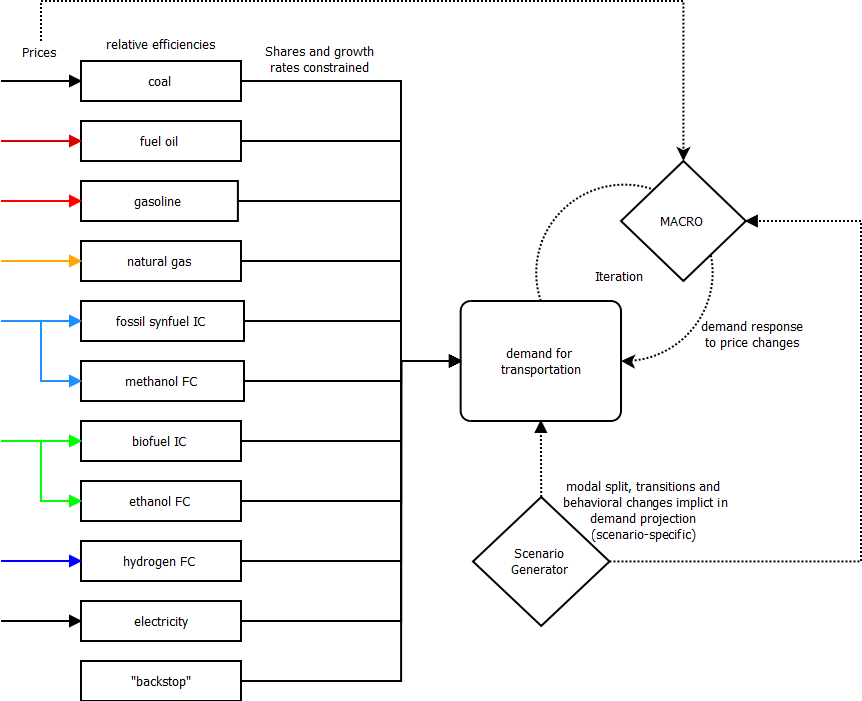
Fig. 13 Schematic diagram of the stylized transport sector representation in MESSAGEix.
The demand for international shipping is modeled in a simplified way with a number of different energy carrier options (light and heavy fuel oil, biofuels, natural gas, and hydrogen). The demand for international shipping is coupled to global GDP development with an income elasticity, but to date no demand response in mitigation scenarios is implemented.
Table 18 presents the quantitative translation of the the storyline elements of SSP1, SSP2 and SSP3 in terms of electrification rate for transport (Fricko et al., 2017 [17]).
SSP1 |
SSP2 |
SSP3 |
|
Transport |
High electrification (max. 75% of total transport possible) |
Medium electrification (max. 50% of total transport possible) |
Low electrification (max. 10% of total transport possible) |