Industrial sector
Similar to the residential and commercial sectors, the industrial sector in MESSAGEix distinguishes two demand categories, thermal and specific. Thermal demand, i.e., heat at different temperature levels, can be supplied by a variety of different energy carriers while specific demand requires electricity (or a decentralized technology to convert other energy carriers to electricity).
This stylized industrial thermal energy demand includes fuel switching as the main option, i.e., different final energy forms that provide energy for thermal energy can be chosen from. In addition to the alternative energy carriers that serve as input to these thermal energy supply options, their relative efficiencies also vary. For example, solid fuels such as coal have lower conversion efficiencies than natural gas, direct electric heating or electric heat pumps. To account for the fact that some technologies cannot supply temperature at high temperature levels (e.g., electric heat pumps, district heat), the share of these technologies in the provision of industrial thermal demand is constrained. Additional demand reduction in response to price increases in policy scenarios is included via the fuel switching option (due to the fuel-specific relative efficiencies) as well as via the linkage with the macro-economic model MACRO (see Fig. 15 below). The specific industrial demand can be satisfied either by electricity from the grid or with decentralized electricity generation options such as fuel cells and on-site CHP.
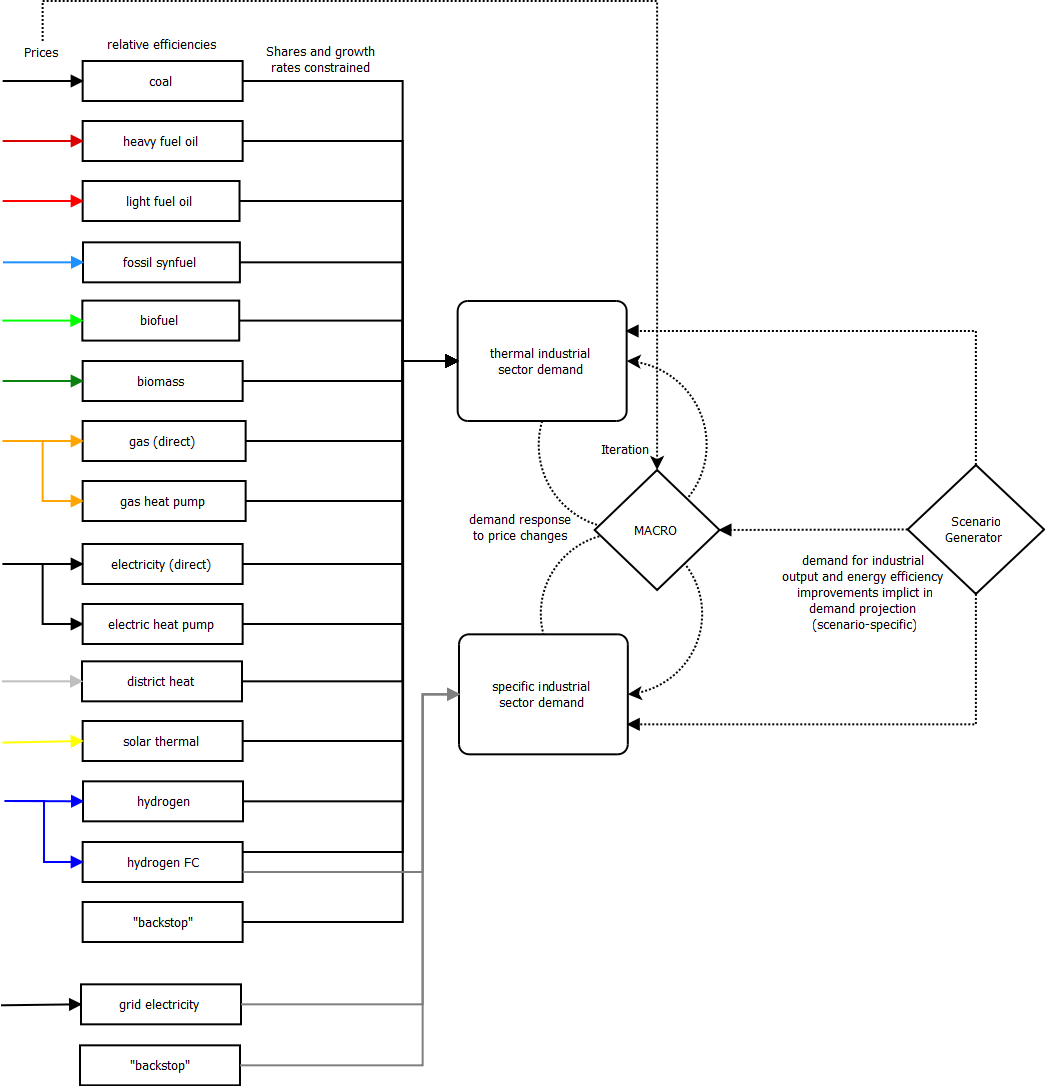
Fig. 15 Schematic diagram of the industrial sector representation in MESSAGEix.
While cement production is not explicitly modeled at the process level in MESSAGEix, the amount of cement production is linked to industrial activity (more specifically the industrial thermal demand in MESSAGEix) and the associated CO2 emissions from the calcination process are accounted for explicitly. In addition, adding carbon capture and storage to mitigate these process-based CO2 emission is available.
Table 20 presents the quantitative translation of the the storyline elements of SSP1, SSP2 and SSP3 in terms of electrification rate for industry and feedstocks. These indicators apply to 2010-2100; Intensity improvements are in FE/GDP annually (Fricko et al., 2017 [17]).
SSP1 |
SSP2 |
SSP3 |
|
Industry |
High electrification rate: 0.56% (Regional range from 0.2% to 1.2%) |
Medium electrification rate: 0.47% (Regional range from 0.07% to 1.08%) |
Low electrification rate: 0.12% (Regional range from -0.03% to 0.71%) |
Feedstock (non-energy use) |
High feedstock reduction rate: -0.33% (Regional range from -0.51 to 0.59%) |
Medium feedstock reduction rate: -0.27% (Regional range from -0.45% to 0.64%) |
Low feedstock reduction rate: -0.24% (Regional range from -0.38% to 0.51%) |