Electricity
MESSAGE covers a large number of electricity generation options utilizing a wide range of primary energy sources. For fossil-based electricity generation technologies, typically a number of different technology variants with different efficiencies, environmental characteristics and costs are represented. For example, in the case of coal, MESSAGE distinguishes subcritical and supercritical pulverized coal (PC) power plants where the subcritical variant is available with and without flue gas desulpherization/denox and one internal gasification combined cycle (IGCC) power plant. The supercritical PC and IGCC plants are also available with carbon capture and storage (CCS) which also can be retrofitted to some of the existing PC power plants (see Fig. 7). Table 12 below shows the different power plant types represented in MESSAGE.
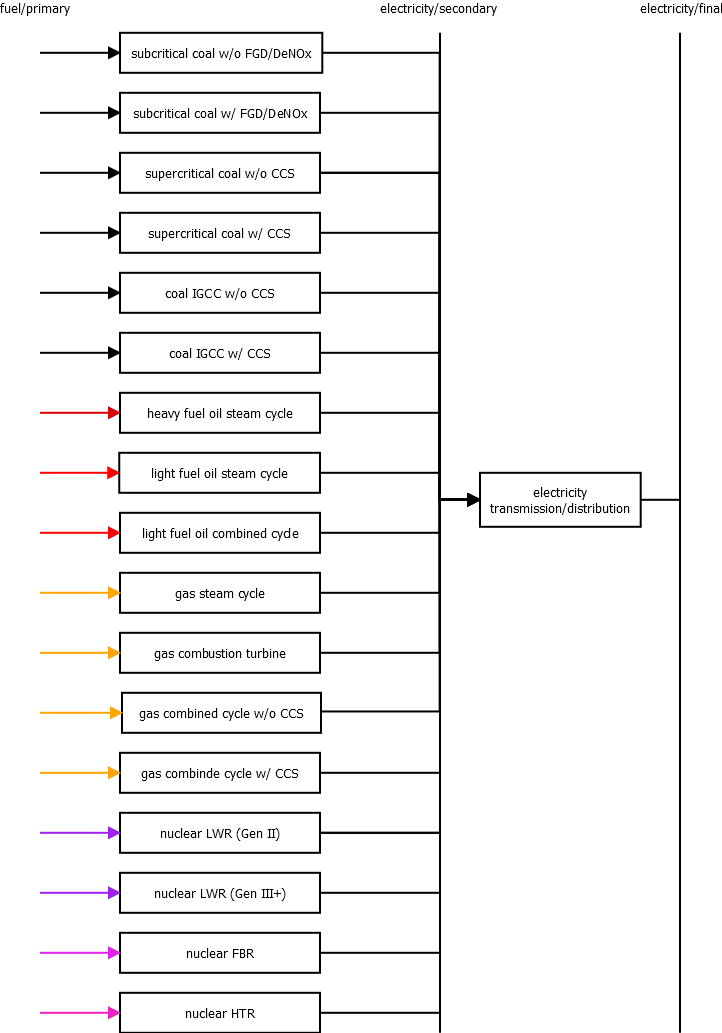
Fig. 7 Schematic diagram of the fossil and nuclear power plants represented in MESSAGEix.
Four different nuclear power plant types are represented in MESSAGE, i.e. two light water reactor types, a fast breeder reactor and a high temperature reactor, but only the two light water types are included in the majority of scenarios being developed with MESSAGE in the recent past. In addition, MESSAGE includes a representation of the nuclear fuel cycle, including reprocessing and the plutonium fuel cycle, and keeps track of the amounts of nuclear waste being produced.
The conversion of five renewable energy sources to electricity is represented in MESSAGE (see Fig. 8). For wind power, both on- and offshore electricity generation are covered and for solar energy, photovoltaics (PV) and solar thermal (concentrating solar power, CSP) electricity generation are included in MESSAGE (see also sections on Non-Biomass Renewable Resources and Systems Integration and Reliability). Two CSP technologies are modeled: (1) a flexible plant with a solar multiple of one (SM1) and 6 h of thermal storage and (2) a baseload plant with a solar multiple of three (SM3) and 12 h of storage (Johnson et al. 2016, [38]).
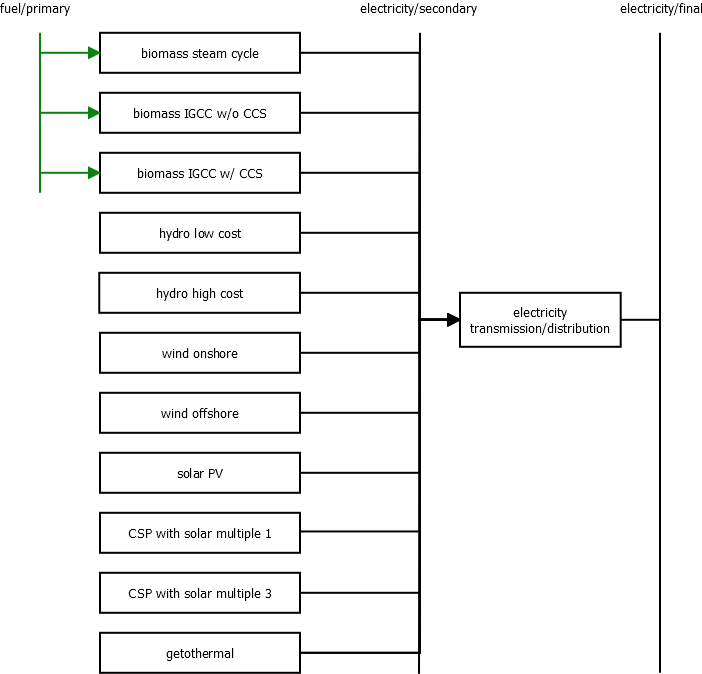
Fig. 8 Schematic diagram of the renewable power generation options represented in MESSAGEix.
Most thermal power plants offer the option of coupled heat production (CHP, see Table 12). This option is modeled as a passout turbine via a penalty on the electricity generation efficiency. In addition to the main electricity generation technologies described in this section, also the co-generation of electricity in conversion technologies primarily devoted to producing non-electric energy carriers (e.g., synthetic liquid fuels) is included in MESSAGE (see section on Other conversion).
Energy source |
Technology |
CHP option |
|---|---|---|
coal |
subcritical PC power plant without desulphurization/denox |
yes |
subcritical PC power plant with desulphurization/denox |
yes |
|
supercritical PC power plant with desulphurization/denox |
yes |
|
supercritical PC power plant with desulphurization/denox and CCS |
yes |
|
IGCC power plant |
yes |
|
IGCC power plant with CCS |
yes |
|
oil |
heavy fuel oil steam power plant |
yes |
light fuel oil steam power plant |
yes |
|
light fuel oil combined cycle power plant |
yes |
|
gas |
gas steam power plant |
yes |
gas combustion turbine gas |
yes |
|
combined cycle power plant |
yes |
|
combined cycle power plant with CCS |
yes |
|
nuclear |
nuclear light water reactor (Gen II) |
yes |
nuclear light water reactor (Gen III+) |
yes |
|
fast breeder reactor |
||
high temperature reactor |
||
biomass |
biomass steam power plant |
yes |
biomass IGCC power plant |
yes |
|
biomass IGCC power plant with CCS |
yes |
|
hydro |
hydro power plant (2 cost categories) |
no |
wind |
onshore wind turbine |
no |
offshore wind turbine |
no |
|
solar |
solar photovoltaics (PV) |
no |
concentrating solar power (CSP) with a solar multiple of 1 (SM1) |
no |
|
concentrating solar power (CSP) with a solar multiple of 3 (SM3) |
no |
|
geothermal |
geothermal power plant |
yes |
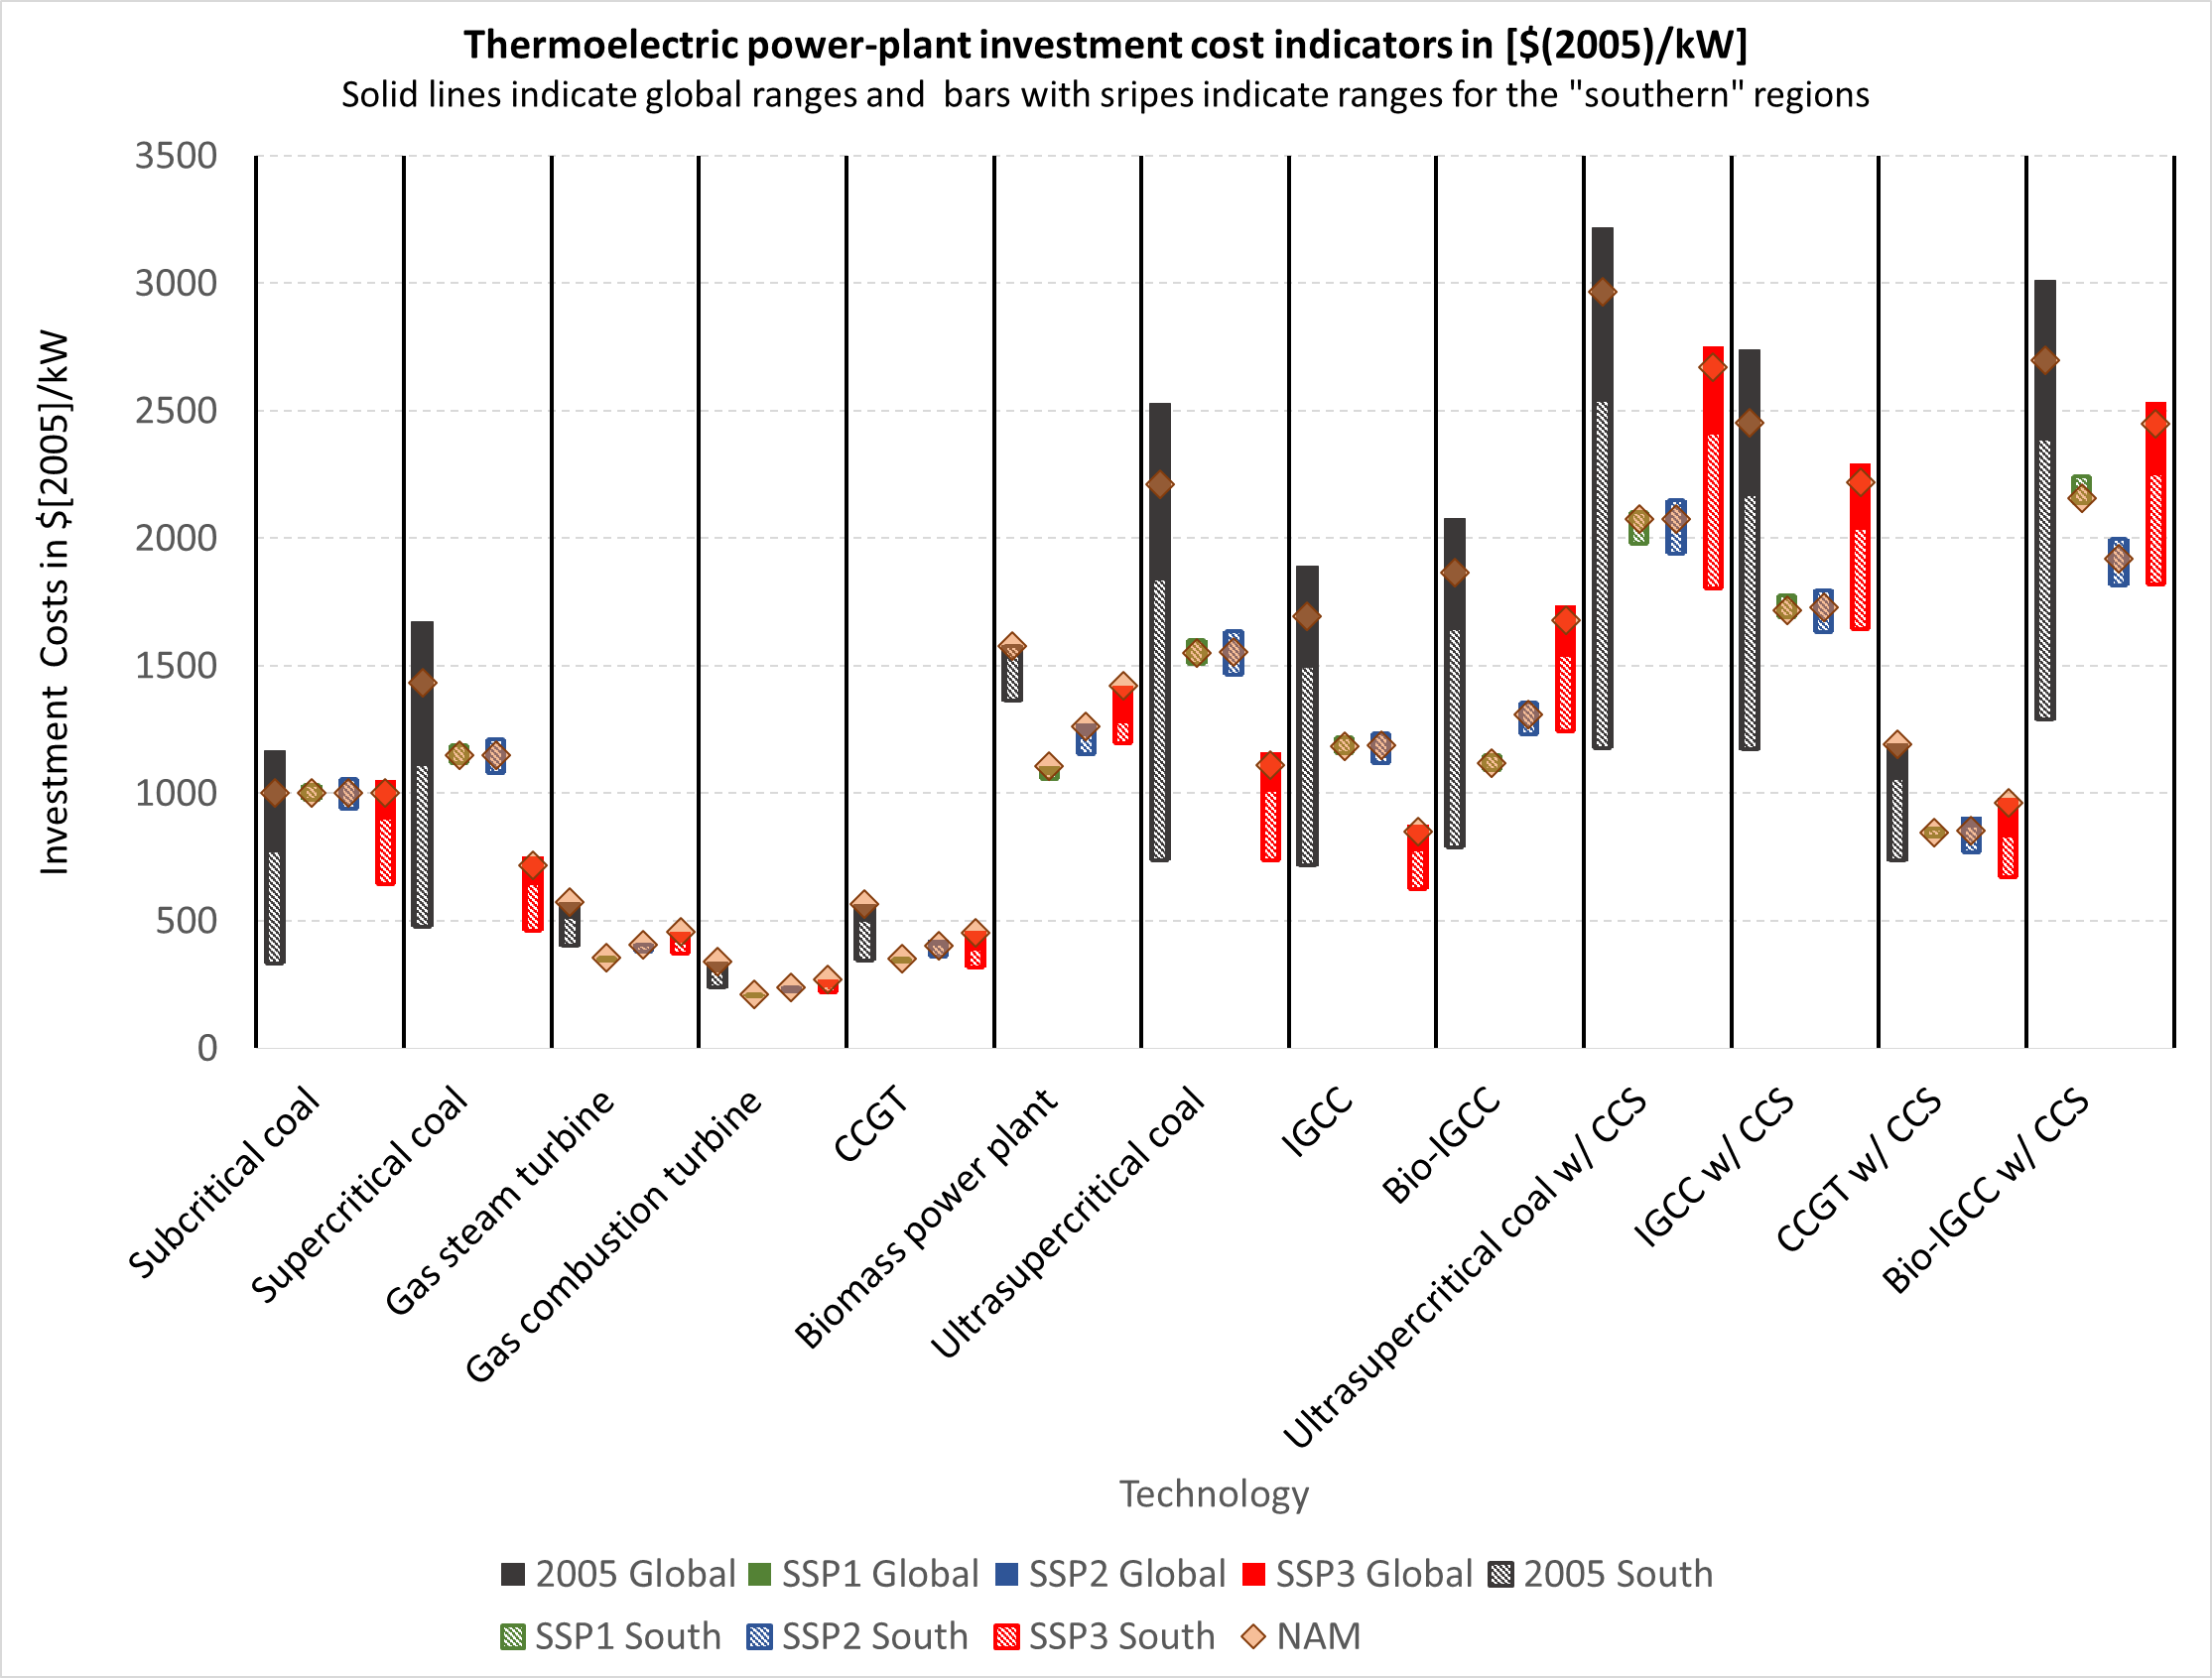
Fig. 9 Cost indicators for thermoelectric power-plant investment (Fricko et al., 2017 [17]).
In Fig. 9, the black ranges show historical cost ranges for 2005. Green, blue, and red ranges show cost ranges in 2100 for SSP1, SSP2, and SSP3, respectively (see description of the SSP narratives). Global values are represented by solid ranges. Values in the global South are represented by dashed ranges. The diamonds show the costs in the “North America” region (Fricko et al., 2017 [17]).
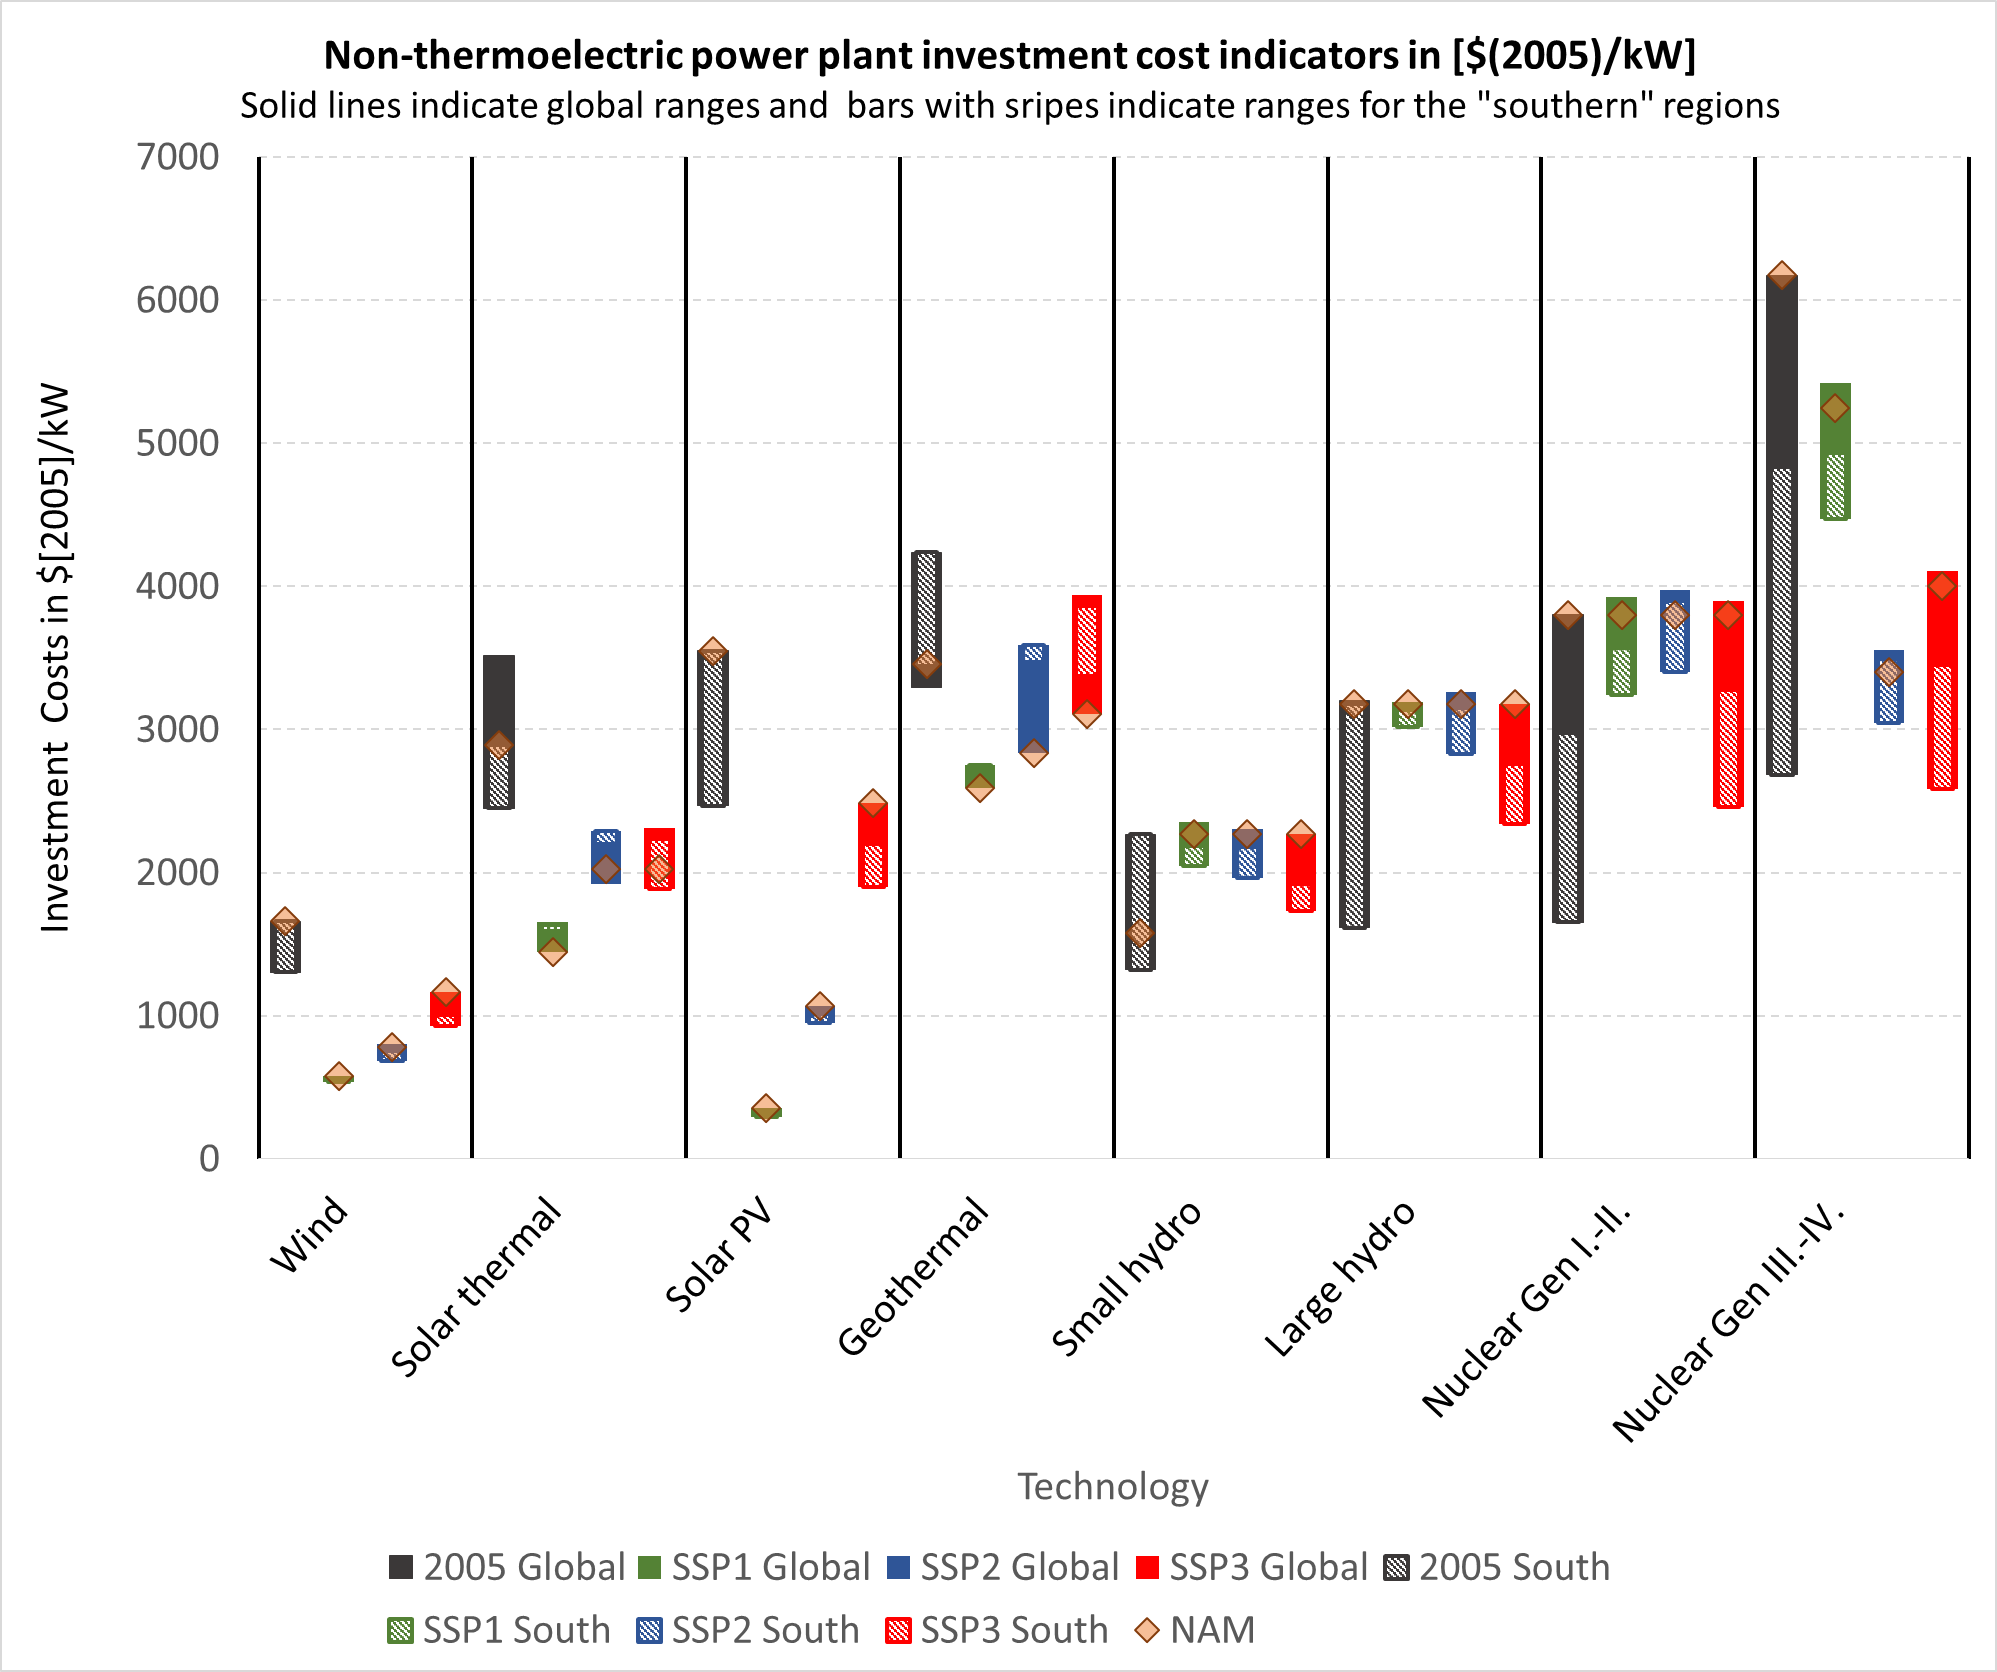
Fig. 10 Cost indicators for non-thermoelectric power-plant investment (Fricko et al., 2017 [17]). Abbreviations: CCS – Carbon Capture and Storage; IGCC – Integrated gasification combined cycles; ST – Steam turbine; CT – Combustion turbine; CCGT – Combined cycle gas turbine
In Fig. 10, the black ranges show historical cost ranges for 2005. Green, blue, and red ranges show cost ranges in 2100 for SSP1, SSP2, and SSP3, respectively. Global values are represented by solid ranges. Values in the global South are represented by dashed ranges. The diamonds show the costs in the “North America” region. PV – Photovoltaic (Fricko et al., 2017 [17]).